Excel tips & tricks with Thread reports
All Thread reports, whether from the Reports page, or using Export option wherever available, can be exported to an Excel spreadsheet. When you open the report in Excel, there are many ways you can utilise the data further using various Excel functions.
Exporting a Thread report to Excel
To export any Thread report to an Excel, simply click on the Export to Excel button at the bottom, and a spreadsheet will download to your device.
Click on the downloaded report to open it in Excel.
Searching by word
You can easily find anything in the exported report by just typing in what you are looking for in the Find box.
Sort and Filter
When you open your report in Excel, select the first row and on the Home tab choose Sort & Filter dropdown.

You can combine sort and filter, to view only the selected data in the order you need.
Sort
If you wish to sort the report A - Z ascending or descending, such as by client name, or date created, select either of the Sort options. Choosing Custom Sort allows you to choose which column you wish to be sorted alphabetically.
Filter
If you wish to filter the report by any of the values, such as file owner, or time type, select the Filter option.
You will notice that all columns will now have an arrow on the right where you can choose the value by which you wish to filter. You can untick '(Select All)' and only tick the boxes of the values you wish to show, such as your own name if you want to only see the results for files you are the owner of.
You can apply multiple filters at once, for example to filter the report to show only your files, and only the Unbilled time other than 0.
Filtering by Date Range
You might want to further filter your report to show you only a specific date range. For example, when pulling a time report on a file, but you only want to see the time recorded last month.
Some reports might need an extra step to format your data as Date in order to use the 'Date Filters'. If yes, please follow the steps below first to format the Date column to Date format. Then, you can go ahead and use the Date Filters as needed.
Formatting data as Date
1. Select the Date column, and in the Data tab, click on Text to Columns. In the pop-up that opens, click on Delimited, and choose Next.
2. Tick the Tab and Space box, and then Next.
3. In the last box, choose the Date option and select the DMY format, then click Finish.
4. Your selected column will now show in the date format, and you can select it again to choose either a Short Date or Long Date, from the Home tab.
Using Date Filters
When your data is showing as a Date Format, you can now choose to filter the report using Date Filters.
1. Select the column with the dates, and choose Filter option.
2. Click on the arrow right of the column name, and choose Date Filters.
3. You can now use any of the options provided, for example Between.. and specify the time period you wish to see.
You can also sort the dates in sequential order using the Sort options.
Filtering 0 Time Values
If you want to view only the time logged on your report without any entries with no time, you can easily do this by filtering the Time column to show only values greater than 0.
This way you would only see in the report entries that have time logged (Billed or Unbilled).
Calculate Totals
If you need to see the totals of values in a column, such as total time spent or value, you can easily do this by using the function =AGGREGATE(9,3,range of cells)
Example: =AGGREGATE(9, 3, A1:A10)
Here’s what each part of the function does:
9 is the function number for SUM within AGGREGATE.
3 is the option to ignore hidden rows, error values, and nested subtotals.
A1:A10 is the range of cells you want to sum
This formula will return the sum of the visible cells in the range A1:A10, excluding any cells with errors and ignoring any hidden rows.
Example in a Thread report that has been filtered and sorted:
= 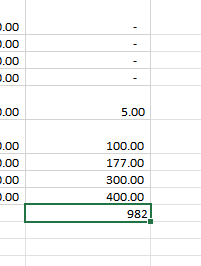
Beware that some reports may already include totals per file, which will be included in your calculation. Please see the steps below to remove those totals, so your calculation would show correctly only the total of individual entries.
Removing Existing Totals
Some Thread reports would already have multiple totals included. If your report already has totals included, but you don't want those totals to be counted in your calculations, you will need to filter or remove these so it doesn't include it in the sum. Thread reports would usually show totals in Italics. Follow the steps below to find all cells with Italics formatting.
This method allows you to find and filter cells with Italics format:
1. Select the data range where you want to find the cells with italics (e.g. 'Value' column)
2. Press Ctrl + F to open the Find and Replace dialog, or just click on Find & Select from the toolbar.
3. Click Options to expand the dialog, then click Format to display the Find Format dialog.
4. Under the Font tab, select Italic from the font style list.
5. Click OK, then next to Search: select By Columns, and next to Look in: select Values. Click Find All to list all cells with Italic format.
6. Once you found all the totals in the spreadsheet, you can choose to delete them or replace them with blank space.
If you wish to delete these rows, simply select the row and choose Delete.
If you wish to Replace All with 0 values, click on Replace, enter a blank space in 'Replace with' field, and click on Replace All.
If you wish to easily select and delete all totals in the spreadsheet, you can apply a different font color or background color to these cells, by choosing the Replace option, then Format next to 'Replace with', and selecting the text color.
You can then use the Filter function to filter them by the applied color, and delete those rows.
Formatting data to Currency
If you wish to show some data in your report as a currency, such as the rate, and value, you can switch the cells formatting to currency selecting the relevant currency you need.
1. Select the columns where you have date that needs to show as a currency.
2. In the Home tab, click on the Number Format box dropdown, and select Currency.
3. The data in selected columns will automatically show as a currency. If the currency showing isn't the one you need, click on the Number Format expand button in the bottom right corner to see more options.
4. Select the relevant currency symbol, and choose OK.
Your selected columns will now show the correct currency.
Finding Duplicates
You might want to use Excel to quickly find any duplicates in your data. For example, this will help you find any files or contacts that are duplicated in the system.
Note: You can also easily check for any duplicates when adding contacts or files to Thread by turning on conflict check in your admin settings.
Finding Duplicate Contacts
From your Contacts page, click on Export to open the report in Excel.
Once you open the report in Excel, you will need to insert a column where you can merge the First name, Middle name and Last name columns into one. Click on the column after the Last name, and Insert a new column.
In the first cell of the new column, enter the formula to merge the columns. For example, if ‘First Name’ is in column E, 'Middle name' in column F, and ‘Last Name’ in column G, you can use the formula: =CONCATENATE(E2, " ", F2, " ", G2)
To apply the same formula to the entire column, select the first cell in the column where you have the formula applied, point to the small plus icon at the bottom-right corner of the cell, and double click it. Excel will automatically fill the formula down the column to the last adjacent cell with data.
You can give your new column a name such as Full name, and it will now look like this.
You may already notice some duplicates showing there, but to quickly mark all duplicates in the report, select the column again, then click on Home tab -> Conditional Formatting -> Highlight Cells Rules -> Duplicate Values
Select how you want the duplicate values to show on the report.
All your duplicate contacts will now show in red in the spreadsheet, so you can easily find them, go back to Thread and remove them as needed.

You can turn on conflict check for contacts on your Thread to avoid creating duplicated contacts. See Conflict Check - Admin for more details.
Finding Duplicate Files
On your files page, choose the relevant filters, and then click on Export. Select the Export to Excel option at the bottom.
When you open the report in Excel, select the column with file names, and click on Conditional Formatting -> Highlight Cells Rules -> Duplicate Values
Select how you want the duplicate values to show on the report.
Select the column again, and apply a filter.
From the filter dropdown, choose Filter by Font Color if this was your chosen duplicates value format, and select the relevant color.
You will now see a list of all your duplicates in the report, and you can decide if you need to delete, or rename these files in Thread.
Related Articles
How To: File Reports
The File Reports section of Thread provides users with a complete overview of how much time members in the organisation have spent on files and the cost of time spent. File Reports can be viewed based on the specific file owner, all file owners and a ...How To export an Archived Matters Report
Viewing and Exporting Archived Matters Report 1. Click Reports on the left side pane of Thread. 2. Click Management Reports from the drop-down menu. 3. On the Managements Reports page, Select Archived matters and set preferred From/To Date filters: ...How To export a Fees Paid Report
Viewing and Exporting Fees Paid Report 1. Click Reports on the left side pane of Thread. 2. Click Management Reports from the drop-down menu. 3. On the Managements Reports page, Select Fees Paid in a time period and set preferred From/To Date ...Power BI Reporting with Thread
Connect your Thread data to Power BI for reporting. Follow the steps below to set up and build your reports, so you can manage them any time in your Power BI. Create a Power BI Workspace In your browser, go to app.powerbi.com and sign-in using the ...How To: Task Reports
Thread can automatically generate reports listing all tasks that have been created on the application. The report includes the name of the task, the subject, the file code (if linked to a file), the due date and time, a description, the status, and ...